500 error when deployed
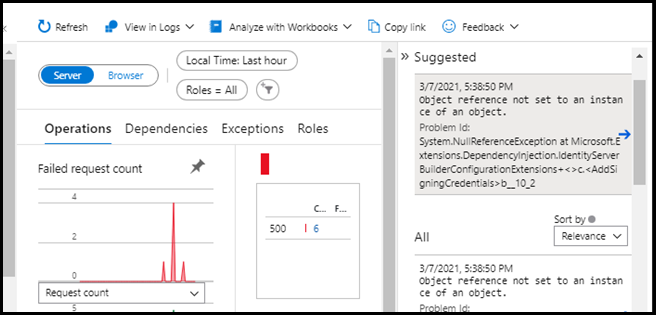
Object reference not set to an instance of an object.
Problem Id:
System.NullReferenceException at Microsoft.Extensions.DependencyInjection.IdentityServerBuilderConfigurationExtensions+<>c.<AddSigningCredentials>b__10_2
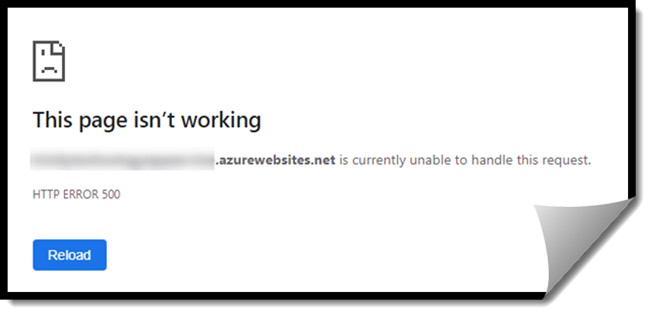
This can be tough to diagnose if you are not deployed to Azure [with application insights enabled]. With app insights the message is not real helpful, but a clue lies in the “identityServerBuildConfigurationExtension”
To verify the issue is with identity server configuration you can update the appsettings.json as shown below and redeploy. If the site comes up but you can’t access the default “Fetch data” (see image) then this is the source of your problem; identity server configuration.

in the appsettings.json add the following section:
    "Key": {
      "Type": "Development"
    }
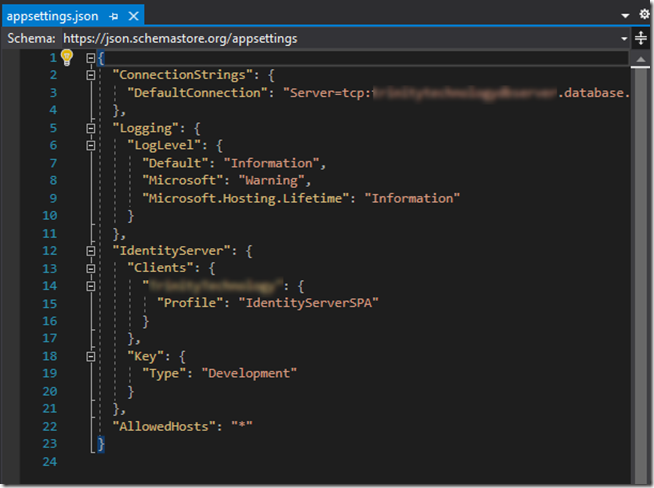
The application will now run [in azure], however this configuration should not be used in a production environment. The following link provides the steps [links] to “Deploy to Azure App Service”
Note: this fix will allow your site to work if you are deploying to Azure [because it is a secure site using https], however if you are trying to deploy to an ISP using http you'll have some more work because http causes error when deployed
16. January 2020
Admin
VSCode
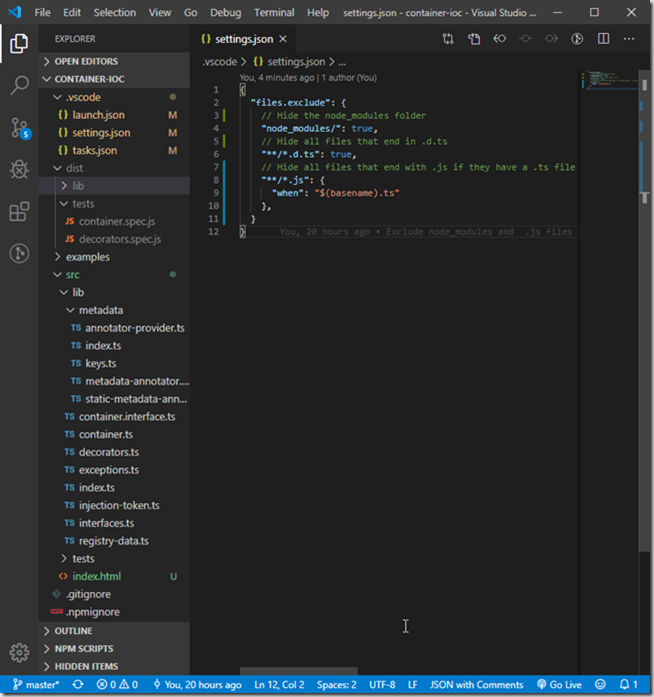
1. Create a settings.json file under the .vscode folder if it does not exist.
2. Add the following settings and save
{
  "files.exclude": {
    // Hide the node_modules folder
    "node_modules/": true,
    // Hide all files that end in .d.ts
    "**/*.d.ts": true,
    // Hide all files that end with .js if they have a .ts file
    "**/*.js": {
      "when": "$(basename).ts"
    },
  }
}
23. November 2019
Admin
VS Code
.vscode.zip (1.91 kb)
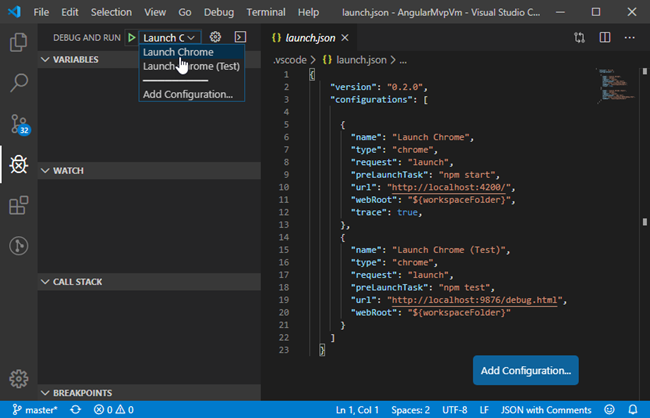
Figure 1. Launch debugger in Chrome
- Ensure Debugger for Chrome extension is installed (figure 2)
- In .vscode folder add launch (figure 3) and tasks (figure 4) json files
- From VS Code debug select Launch Chrome or Launch Chrome (Test)
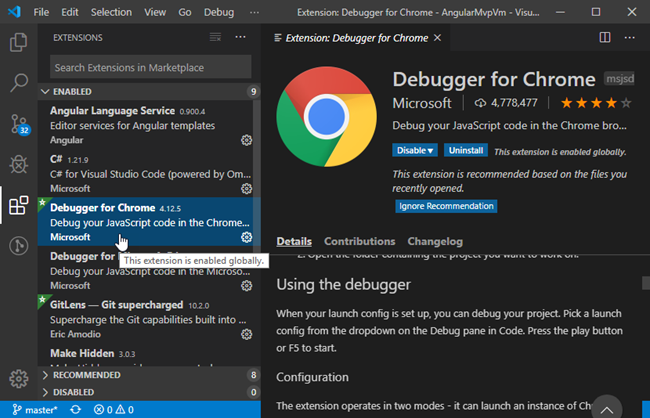
Figure 2. Visual Studio Code extension for Debugger for Chrome
{
    "version": "0.2.0",
    "configurations": [

      {
        "name": "Launch Chrome",
        "type": "chrome",
        "request": "launch",
        "preLaunchTask": "npm start",
        "url": "http://localhost:4200/",
        "webRoot": "${workspaceFolder}",
        "trace": true,
      },
      {
        "name": "Launch Chrome (Test)",
        "type": "chrome",
        "request": "launch",
        "preLaunchTask": "npm test",
        "url": "http://localhost:9876/debug.html",
        "webRoot": "${workspaceFolder}"
      }
    ]
  }
Figure 3. launch.json file
{
    "version": "2.0.0",
    "tasks": [
      {
        "label": "npm start",
        "type": "npm",
        "script": "start",
        "isBackground": true,
        "group": {
          "kind": "build",
          "isDefault": true
        },
        "problemMatcher": {
          "pattern": "$tsc",
          "background": {
              "beginsPattern": {
                  "regexp": "(.*?)"
              },
              "endsPattern": {
                  "regexp": "Compiled |compile."
              }
          }
        }
      },
      {
        "label": "npm test",
        "type": "npm",
        "script": "test",
        "problemMatcher": [],
        "group": {
          "kind": "test",
          "isDefault": true
        }
      }
    ]
  }
Figure 4.
tasks.json file